Site Map
Lesson plan
Glossary
Timeline
Overview talk
Questions & Answers
Central Home Page
#M-7 Trigonometry


(11)  Graphs and Ellipses


  Index

9a. Earth orbits Sun?

9b. The Planets

9c. Copernicus
        to Galileo

10. Kepler's Laws

Kepler's Laws
        (For teachers)

10a. Scale of Solar Sys.

11. Graphs & Ellipses

11a. Ellipses
        and First Law

12. Second Law

12a. More on 2nd Law

12b. Orbital Motion

12c. Venus transit (1)

12d. Venus transit (2)

12e. Venus transit (3)

Newtonian Mechanics

13. Free Fall

14. Vectors

15. Energy

    The laws of orbital motion are mathematical, and one cannot explore them without some mathematics. The math used here is rather elementary; if you need to refresh your familiarity with it, click here. You can also skip the equations and follow the narrative only.

The Mathematical Description of a Curve

    As already noted, the cartesian system labels any point in a plane (e. g. on a flat sheet of paper) by a pair of numbers (x,y), its distance from two perpendicular axes. These numbers are known as the "coordinates" of the point.
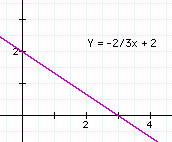
    A line in the plane--straight or curved--contains many points, each with its own (x,y) coordinates. Often there exists a formula ("equation") which connects x and y: for instance, straight lines have a relationship

y = ax + b

    where any pair of numbers (a,b), positive, negative or zero, gives some straight line. The plot of a line given by one of such relationship (or indeed by any relationship--even pure observation, e.g. temperature against time) is known as a graph. More complicated relationships give graphs that are curves: for instance

y = ax2
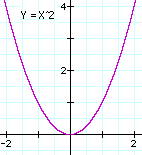
    gives a parabola, with a any number. Usually (though not always) y is isolated, so that the formula has the form

y = f(x)

    where f(x) stands for "any expression involving x" or in mathematical terms, a "function of x." The curves drawn here are the straight line y = -(2/3)x + 2 and the parabola y = x2. A list of some of their points follows below; if you have paper ruled in squares (as in the images here), mark the points and then try to connect them smoothly, with no sharp bends.

              Straight line:
  x   -1   0   1   2   3   4
  y   8/3   2   4/3   2/3   0   -2/3

Parabola:

  x   -2   -1.5   -1   -0.5   0   0.5   1   1.5   2
  y   4   2.25   1   0.25   0   0.25   1   2.25   4

The Equation of a Circle

In the vast majority of formula-generated graphs, the formula is given in the form

y = f(x)

    Such a form makes it very easy to find points of the graph. All you have to do is choose x, calculate f(x) (= some given expression involving x) and out comes the corresponding value of y.

    However, any equation involving x and y can be used as the property shared by all points of the graph. The main difference is that with more complicated equations, after x is chosen, finding the corresponding y requires extra work, (and sometimes it is easier to choose y and find x).

Perhaps the best-known graph of this kind is a circle of radius R, whose equation is

x2  +  y2  =   R2

    Draw a circle of radius R centered at the origin O of a system of (x,y) axes . Given any point P on the circle with specified values of (x,y), draw a perpendicular line from P to point A on the x-axis. Then

x = OA        y = AP       R = OP

    Here x and/or y may be negative, if they are to the left of the y-axis or below the x-axis, but regardless of sign, x2 and y2 are both always positive. Since the triangle OAP has a 90° angle in it, by the theorem of Pythagoras, for any choice of P, the relation below always holds:


OA2  +  AP2  =   OP2

or with the choice of (x,y) coordinates

x2  +  y2  =   R2

The equation of the circle is satisfied by any point located on it. For instance, if the graph is defined by the equation:

x2  +  y2  =   25

this equation is satisfied by all the points listed below; again, if you can, plot the connecting curve on a sheet of square-ruled paper

  x   5   4   3   0   -3   -4   -5   -4   -3   0   3   4 ( 5 )
  y   0   3   4   5   4   3   0   -3   -4   -5   -4   -3 ( 0 )

The Equation of an Ellipse

The equation of the circle still expresses the same relation if both its sides are divided by R2:

(x2/R2)  +  (y2/R2)  =   1

The equation of an ellipse is a small modification of this:

(x2/a2)  +  (y2/b2)  =   1

where (a,b) are two given numbers, for example (8,4). What would such a graph look like? Near the x axis, y is very small and the equation comes close to

(x2/a2)  =   1

From which

x2 = a2 and hence x = a  or x = –a   (sometimes combined into x = ±a)

The graph in that neighborhood therefore resembles the section of a circle of radius a, whose equation

(x2/a2)  +  (y2/a2)  =   1

also comes close to x2 = a2 in this region. In exactly the same way you can show that near the y-axis, where x is small, the graph cuts the axis at y=±b and its shape there resembles that of a circle of radius b.

An example

Let us draw the ellipse

(x2/64)  +  (y2/16)  =   1

We already know that it cuts the axes at x=±8 and at y=±4. Let us now add a few points:

(1)   Choose y = 2 . Then from the equation

(x2/64)  +  (4/16)  =   1

Substract 1/4 from both sides

(x2/64)  =3/4

Take square roots (marked here by √) and retain an accuracy of 3-4 decimals:

x/8 = √3 / √4 = 1.732/2 = 0.866

from which  x = 6.93 within resonable accuracy.

(2)   Choose y = 3 .
(x2/64)  +  (9/16)  =   1

Substract 9/16 from both sides

(x2/64)  =7/16

Take square roots (to an accuracy of 3-4 figures):

x/8 = √7 / √16 = 2.6457/4 = 0.6614

from which, approximately,  x = 5.29

Again, either sign can be attached to x and y. We get 12 points, enough for a crude graph (which you might try to trace on paper):

  x   8   6.93   5.29   0   -5.29   -6.93   -8   --6.93   -5.29   0   5.29   6.93 ( 8 )
  y   0   2   3   4   3   3   0   -2   -3   -4   -3   -2 ( 0 )

A Different View of the Ellipse

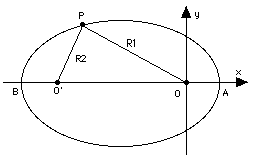
 The collection of all points for
 which R1 + R2 has the same value
  is an ellipse
    The ellipse was already familiar to ancient Greek scientists (known at their time as "philosophers", lovers of wisdom), but they defined it differently. To them the ellipse was the collection of all points (in a flat plane) for which the sum of the distances R1 + R2 from two given points was the same (see drawing).

    It was a natural extension of the definition of a circle, which is the collection of all points at the same distance (the radius R) from one given point (the center). One point and the distance R defines a circle, two points and the distance R1 + R2 define an ellipse.

The two points were called the foci of the ellipse (each one is a focus), and they are important here, because Kepler found that the Sun always occupied a focus of the orbital ellipse, not (as one might perhaps think) the center--i.e. the origin of the (x,y) system in which the ellipse is given by the equation

(x2/a2)  +  (y2/b2)  =   1

    The foci are always located on the longer of the two symmetry axes of the ellipse, the (x, y) axes when the above equation is used. That is the major axis of the ellipse. If a is larger than b, the major axis lies along the x-axis, and we leave it to you to show that in such a case

R1 + R2 = 2a

    [Hint: Make a sketch of the ellipse and the axes which define it, mark one of the points at which it crosses the x-axis, and examine R1 and R2 of that point].
    The value of a in an elliptic orbit is known in astronomy as the semi-major axis and it is regarded as one of the six orbital elements which define the motion according to Kepler's laws.

Whispers in the US Capitol

    The foci of an ellipse have an interesting property. An ellipsoid of revolution is the 3-dimensional figure obtained by rotating an ellipse around one of its axes. If a hollow ellipsoid of this shape is made and its inner surface is silvered to act as a mirror, then if a source of light is placed at one focus, all of its rays will converge at the other one. Even if only part of the ellipsoid is silvered, all light hitting that part will still be concentrated at the other focus.

Sound waves can behave like light, too. The chamber (room) in the US capitol in Washington where the House of Representatives used to meet has a ceiling shaped like a quadrant (half of a half) of an ellipsoid, with its foci near the floor. This was done for architectural reasons, nearly 200 years ago, but it also enabled a person at one focus to overhear anything spoken at the other focus, even whispers. Supposedly, Daniel Webster sat at one such spot and made good use of its special nature.

Today the House of Representatives has many more members, uses a much bigger chamber and its old meeting room is a museum displaying statues of distinguished Americans.

Every year many thousands of visitors are guided through that chamber. At one time during their visit, they gather at or near one focus (identified by a brass marker on the floor), to catch whispers by their guide who stands at the other one. By the way, a well-known painting of that chamber, with faces of its occupants clearly identifiable, was made by Samuel Morse, the artist who also invented the electric telegraph. A copy of that painting and its story are also shown in the room; the original is in the Corcoran gallery in Washington.


Questions from Users:  
The equation of a parabola  

Next Stop, for those
familar with trigonometry--
#11a Ellipses and Kepler's First Law

Otherwise, next stop is: #12 Kepler's Second Law

            Timeline                     Glossary                     Back to the Master List

Author and Curator:   Dr. David P. Stern
     Mail to Dr.Stern:   stargaze("at" symbol)phy6.org .

Last updated: 10 October 2016